Chapter 6:
Deming’s 14 points
Introduction to the 14
Points
It
is important to have an appreciation of the following "fundamental
knowledge" concerning the 14 points as a whole before we attempt to
examine and discuss each of the 14 points individually :
The 14 points were developed
gradually during a period of 20 years. They are not written on 'Tablets
of Stone'. Indeed many minor and a few major adjustments were made to them from
time to time, reflecting the way Deming saw the world changing and the changing
needs of the people with whom he worked. These 'enhancements and refinements'
demonstrated his continued flexibility and responsive attitude to the changing
industrial environment.
The points do not constitute the
whole of the Deming philosophy, though they are especially important
constituents of it – rather they are 14 consequences of his philosophy . They are not a list of
instructions, they are not techniques, they are not a check list. There is a
great danger in simply obeying the words without first studying and developing
a deep understanding of why he is saying these things. To treat the 14 points just as a recipe may be a pretty sure recipe for
disaster!
They
are vehicles for opening up the mind to new thinking, to the possibility that there are radically
different and better ways of organising our business and working with people.
Any
full adoption of the Deming philosophy will require full attention and movement
towards the principles expressed in the 14 points. However, the need is not
simply to adopt the 14 points, individually or collectively, but to create a new environment which is
fully consistent with and conducive to them. They may be regarded, not as
'steps to be taken' but as 'goals to be achieved'. Deming does not call for
'overnight changes'. This is not a
'project', nor a 'program'. This is never-ending – forever.
The
context of the14 points is a commitment to continual improvement in Quality, in
it's widest sense and interpretation, and what is needed to fulfil that
commitment. This involves a lot of action, education and understanding of why
that action is needed, and of the pathways that need to be cleared before some
of the action becomes appropriate.
Beware
of dismissing Deming's thoughts because some of what he says appears impossible
in today's world. This would be indicative of over-concentration on short term
thinking – the 2nd deadly disease! Of
course we have to deal with the short term according to the circumstances in
which we find ourselves. But are we resigned to always staggering from one
short term crisis to another without having any semblance of a long term
direction to look toward.
None
of the 14 points is unimportant and can be ignored. However we can 'implement'
some of the more difficult aspects only after the right foundations have been
laid.
6.1. Point 1: Constancy of
purpose
Create
constancy of purpose for continual improvement of products and service,
allocating resources to provide for long range needs rather than only
short-term profitability, with a plan to become competitive, to stay in
business, and to provide more jobs.
How can such constancy of purpose
be achieved?
By
developing understanding of the need, and by understanding how continual
improvement satisfies that need. That is good and necessary theory. But how
does Deming suggest it can be attained in practice? In schools, colleges and
universities by joy in study; in industry by joy in work. And
Management and employees of any organisation do not have any chance of
joy in work unless the organisation has good, clear and proper long term aims
and principles, genuinely held, with their employees being made fully aware of
them and believing in them :
"Create and publish to all employees
a statement of the aims and purposes of the Company."
And
"The Values and beliefs of the
organisation as set forth by the Top Management are important."
There
must be a consistent, inexorable, never-ending , widespread push for continual improvement in
all activities and operations of the Company. Management's commitment to such
continual improvement is a critical factor for securing the enthusiastic
interest and involvement of employees at all levels , and for enabling them to contribute more.
Such
commitment can only be acquired by people in management taking the trouble to
learn and understand deeply the New Philosophy and then setting a good example
by their consistency of purpose constantly filtering down throughout the
organisation to feed and nurture a constancy of purpose throughout.
What are the other implications of
point 1?
- Focus on long term
– subject to necessary adjustments to overcome short term hazards, but
with sights firmly set on the direction leading to continual improvement, with
the aim to survive, succeed, to serve customers well – and more broadly to
be of service to the country and the world.
- Innovate in order
to be of service to society by expanding the market and creating jobs.
- " It is a
matter of optimisation---management for greatest service, maximum profit,
and the best deal for everybody: employees and customers."
- Appreciate the
danger of "staying bound up in the tangled knot of the problems
of to-day" An important task
of management is to exercise good judgement in allocation of resources and effort to the two sides of
this picture i.e. the problems of today and the problems of tomorrow. Work
for a better tomorrow.
- With lack of
constancy of purpose (short- termism) nobody is really sure why the
Company is in business, or what its aims are, or what the future is likely
to hold in store. This creates instability, which increases variation and
thus reduces Quality. Lack of constancy of purpose also implies lack of
job security.
- "A job
description should not only describe what the job is but also what it is
for." And why? Because: "Anybody's job should not merely be to
'do it right', but to do it better." Also as Deming put it in a paper more than 50
years back: "nobody is doing his job right unless he is continually
collecting data to help improve that job."
6.2. Point 2: The New
Philosophy
Adopt
the new philosophy ( win – win ). We are in a new economic age, created in
What does the New Philosophy imply?
Since
this whole subject is about the new philosophy there is little to mention
specifically under this point which is not mentioned elsewhere. However, some
of the most important aspects are summarised here:
- It is concerned
with a new kind of economics, with a new system of reward based on
co-operation as a system ( rather than as an accident or as isolated
efforts ) instead of competition which can be ruinous.
- It is concerned
with a new thinking on leadership of people, with developing joy in work
and joy in co-operation with others who take joy in their work – as prerequisites
to achieving what needs to be achieved.
- For survival, let
alone success, there is need for a change and that change is to adopt the
new philosophy – the philosophy of continually improving Quality and
productivity, long term and forever.
- The backbone of the
new philosophy is transformation to the culture of co-operation : win-win.
- Adoption of the new
philosophy in practice means breaking down of many strong, thick barriers
to improvement and breaking down of barriers implies transformation of
culture. The barriers include:
·
Unwillingness to change;
·
Fear of failure;
·
Fear of the unknown - "where would change leave
me?";
·
People measuring productivity instead of helping to improve
it ( Deming says there are far more of the former than the latter! );
·
Financial people who merely beat down costs rather than
learning the new philosophy and help accomplish the changes that must take
place and
·
The system of reward.
What is the extent of change which the
new philosophy entails and can it be accomplished in a short time?
It
is important to understand that the new philosophy is not merely a few
guidelines, ideas, rules, or techniques which you can tack on to the end of
whatever you do now. It involves a thorough, radical, rethink – a complete
reversal of attitudes towards some strategies, modes of behaviour and beliefs
to which you have become accustomed and conditioned over the years. If you do
not accept the fact that we are talking of a deep, fundamental change then it
will not happen.
This
change cannot happen overnight. But there must be a constant, consistent
movement in the right direction: every day there must be a move closer to total
involvement in ever improving Quality of all systems, processes and activities
within the organisation.
6.3. Point 3: Cease
dependence on mass inspection
Eliminate the need for mass
inspection as the way of life to achieve Quality by building Quality into the
product in the first place. Require statistical evidence of built-in Quality in
both manufacturing and purchasing functions.
Is Deming saying that we should
abolish inspection?
No
he is not asking us to eradicate all inspection : it is mass inspection which
should go. Mass inspection is costly, wasteful, non-productive; it aims to sort
out good from bad; it does not contribute to progress. There is a world of
difference between :
a) On the one hand,
dependence on inspection as an attempt to provide the customer with something
that he will not complain about and
b) On the other hand, use
of inspection to provide guidance toward improvement of a stable process as
well as to pick up the occasional special cause that creeps unannounced into
that otherwise stable system.
While
inspection should be used in the manner indicated at b), the dependence
indicated at a) is harmful and the aim should be to eradicate such dependence.
Dependence on mass inspection – a
formula for going out of business.
100%
inspection is very expensive and not necessarily 100% effective. Less than 100%
inspection immediately introduces the concept of AQL (Acceptable Quality
Level). The AQL represents a supposedly-acceptable level of defectives, a
contradiction to the philosophy of continual improvement.
The
better way is to build Quality into the process and product in the first place.
Examples of dependence on mass
inspection, the fallibility of inspection procedures and the fallacy of divided
responsibility.
- Deming used to
enjoy showing an advertisement which proclaimed: "Only M----- employs
dozens of testers just to test nozzles." Maybe only M---- needed to!
He interpreted the advertisement as a plain admission that they could not
make it right. Apparently about one-third of the Company's employees were
involved in such testing.
- Instance of a newly
purchased jacket which contained in one of it's pockets as many as 8
inspection tickets such as – Impression – inspected by number 8, Armhole
pressing inspected by number 10, Lapel inspected by number 4 etc. even with
so much of inspection it was found that the lining was loose and that one
of the pockets was not sewn at the bottom! This example also illustrates
the fallibility of inspection procedures and the fallacy of divided
responsibility.
- In his book
"Out of the crisis"( page 30 ), Deming mentions that his friend
David Chambers told him about a printing company that proof read
everything 11 times. Deming further continues:
" Why do you think the manager called on
- At page 208-209 of
"Out of the Crisis" Deming mentions about a company which had
trouble with mistakes on payroll cards – 900 people on the payroll making
1500 mistakes everyday! The payroll department succeeded, only with great
effort, to get cheques to the employees four days after the close of the
week. It was seen that the time card required two signatures--the employee's
and the foreman's. The requirement of two signatures meant that nobody was
responsible: trouble guaranteed. Deming's suggestions were :
a)
Require only the signatures of the employee. Make him
responsible for the card.
b)
Do not ask employee to record nor compute the total for the
day.
Do this arithmetic in the payroll department. The problems evaporated
within a week.
- Another example
often mentioned by Deming in his seminars was an operation which involved
a "picker" and a "checker". One person picked items
off the shelves in order to fill requisitions . A second person then
checked that the right items in the right quantities had been selected.
Management wondered why so many errors were being reported by the
customers of this operation. Deming told them hat the system guaranteed
errors. The picker should become responsible for the whole job: the job
could be done properly by one person and should be. Management followed
his advice and the error rate plummeted. As Deming remarked: "It's
all very simple."
Auditing, validating reports, performance appraisals and proof reading
are examples of widely prevalent mass inspection in non-manufacturing
processes.
Considering the poor Quality in supplies, systems and services and the
high level of mistakes, errors and defects is it at all possible to cease
dependence on mass inspection?
Yes, it indeed requires very high standards but these are being
achieved by those who have accepted and
genuinely adopted Deming's approach.
An undeniable result of reaching consistent high standards (such
consistency being backed by statistical evidence and methods of process
control) is that the expensive, non-productive activity of mass inspection
indeed becomes irrelevant,. Since scrap at source is eradicated.
6.4. Point 4: End Lowest-Tender
contracts
End
the practice of awarding business solely on the basis of price tag. Instead
require meaningful measures of Quality along with price. Reduce the number of
suppliers for the same item by eliminating those that do not qualify with statistical
and other evidence of Quality. The aim is to minimise total cost, not merely
initial cost, by minimising variation. This may be achievable by moving toward
a single supplier for any one item, on a long-term relationship of loyalty and
trust. Purchasing managers have a new job and must learn it.
Why not purchase solely on the
basis of the lowest price?
Because
even if a number of suppliers all satisfy customer needs expressed in terms of
specifications, Quality and hence cost of use can vary enormously. In the real
world of variation it is not possible for all the suppliers to meet the
customer needs exactly.
Even
if there is no problem with specifications and the product from a number of suppliers
is known to be meeting the needs of the customer there will be variation in
other aspects which influence cost of use such as timely delivery, accuracy and
timeliness of their paperwork, assistance in unloading etc.
As the19th century English art critic
"It's unwise to pay too much but it's worse to pay too little.
When you pay too much you lose a little money – that's all. When you pay too
little, you sometimes lose everything because the thing you bought was incapable
of doing the thing it was bought to do."
Should we always opt for a single
supplier on any one item?
Deming's answer: "No – you
have to be practical."
No
one supplier may be able to provide the capacity that you need. Even if the
capacity is there, it may be that none of the potential suppliers may be good
enough to be trusted with the responsibility and privilege of becoming your
single supplier.
Why should we even aim for a single
supplier?
...to
reduce variation, the fundamental requirement for improving Quality. With
multiple suppliers we have a limitation in regard to reduction of variation –
however good they may be they are, of course all different--different
locations, different systems, different processes, different people etc. All
these differences are extra sources of variation compared with the case of a
single supplier. Multiple suppliers are therefore a bar to continuous
improvement.
The
additional variation caused by change of suppliers is self-inflicted injury.
People on the shop floor know that adjustments of machinery to compensate for
such additional variation is time-consuming and costly.
Isn't competitive tender a way to
avoid corruption?
Deming's retort :
"Competitive tender
fosters corruption."
And
also :
"If you feel that a
single supplier is likely to produce complacency, laziness, corruption, falling
behind, then the foundations have not been laid."
What are these foundations which
must be laid before you can move on to single sourcing?
The
relationship must be a customer-supplier partnership of trust and action. This
partnership culture is a prime ingredient of a single-sourcing policy. The
purpose must be to enable construction of a genuine long-term mutually
beneficial relationship involving trust and friendship – a relationship where a
genuine handshake is more powerful than a legal contract.
Such
a partnership culture would imply customer and supplier helping each other. A
supplier often has lots of relevant knowledge that the customer cannot possibly
have. The reverse is also often true. Deming suggests that rather than people
just staying with their colleagues in the working groups, they should instead
work with their suppliers and customers.
A
customer-supplier partnership relationship is an obvious application of the Co-operation
: Win-Win Philosophy. That relationship is not feasible under a policy of
multiple-sourcing. It's spirit is encapsulated in the following words of
"This is what I can
do for you. Here is what you might do for me."
Once
entered into it is vital to the interests of both partners that the long-term
relationship works.
What
are the advantages of having a single supplier?
- Reduced variation
which facilitates continuous improvement of Quality as already discussed.
- A partnership
relationship is possible as also discussed above.
- Prevention and
tackling of emergencies ( fires, strikes, disasters, accidents etc ) can
be done better. These are more likely under traditional arms-length relationships.
Also if a supplier is running into some kind of trouble, the last thing he
will do is to let his customer know about it. In the partnership culture
that will be one of the earliest steps. Maybe the customer can help, or,
if not he will have at least been given fair warning.
- The security of a
long lasting relationship better enables the supplier to innovate. How can
a customer expect a supplier to invest anything very solid into a short
term contract – indeed how can a supplier afford to?
How should a customer set about choosing a
supplier?
Get
talking and interacting to the possible suppliers and find out:
- How they are doing
on the 14 points?
- About their
processes and systems and their approach to statistical control and
improvement.
- Where is their
knowledge and what is it?
- How do they stand
with respect to the 4 prongs of Quality?
- Are they investing
in the right things? Is money being spent on training and on education? –
find out from their financial reports. If they won't tell you then where
is the chance of establishing that long-term trusting partnership?
The
guiding principle for the choice must again be that of Co-operation : Win-Win.
The supplier must be enthusiastic to develop specialist-knowledge about the
needs of the customer beyond those which either of them currently understand,
in order to improve product and service.
The
problem of choosing a single supplier has given rise to one of Deming's
strongest statements :
"The overriding
requirement for a single supplier is his burning desire and ability to work
with you on a long-term basis."
6.5. Point 5: Improve every process
Improve
constantly and forever the system of planning, production and service, in order
to improve every process and activity in the company, to improve Quality and
productivity, and thus to constantly decrease costs. Institute innovation of
product, service and process. It is management's job to work continually on the
system (design, incoming supplies, maintenance, improvement of equipment,
supervision, training, retraining etc.)
Many of the other aspects of
Deming's teachings have direct relevance to this point, for example:
- Obsession with
Quality at the head of the Joiner Triangle.
- Deming cycle – an
aid to continuous improvement and innovation.
- Elimination of mass
inspection as a way of life--to be replaced by continuous improvement and
innovation.
- The Taguchi Loss
function – an argument for continuous improvement rather than merely
meeting specifications. It is also a help in prioritisation of processes
which will bring about improvement, realising that we cannot do everything
at once.
- The four prongs of
Quality which make us realise that improvement of processes, though
necessary, is not enough for survival and success.
Delusions of improvement which we must
watch out for :
- Tampering i.e.
mistaking common causes for special causes, is not improvement of process.
Such 'best efforts' often make things worse!
- Putting out fires
i.e. tackling special causes is not improvement of process. Fire-fighting,
patchwork, cosmetics, solving problems are all to the good when
necessary--but they should not be necessary. Their necessity is a bar to
improvement and innovation.
Examples of failure to improve.
Deming
provides many anecdotes, most of which pertain to service organisations. It is
important to appreciate that point 5 and the teachings of Deming make no
distinction between manufacturing and service industries. Some of the examples
quoted in 'Out of the Crisis' ( Page 95-96 ) are:
- 9 people standing
in the aisle, looking for their seats, detaining plane otherwise ready to
start. Why? They were trying to find their seats. The numbers that
designate the aisle were too small for easy visibility, and obscured by
bright lights alongside the numbers!
- Difficulty to transfer
luggage from one airline to another in most airports. A passenger makes a
connection--the luggage does not.
- A new hotel, with
lights placed so that the keyholes for the doors are in darkness.
- A conveyor belt,
two feet off the floor, carries glass jars of food. Jars fall off, break
and spill messy contents on to floor. A man must be under two feet in
height or crawl on his knees over broken glass to reach under the
conveyor.
What are the essential
pre-requisites for adopting Point 5?
- Seek out potential
problems and 'nip them in the bud' before they have a chance to become
serious and cause trouble.
- Never be content,
even when some problems have been sorted out and improvement obtained.
Identify further problems and solve them to bring about further improvement.
- By problems we mean
common as well as special causes. This means we must strive to make
unstable processes stable, and to make stable but incapable processes
capable and to make capable processes yet more capable.
- Regard problems as
opportunities for improvement and seek them out.
6.6. Point 6: Institute
Training
Institute
Modern methods of training for everybody's job, including management, to make
better use of every employee. New skills are required to keep up with changes
in materials, methods, product design, machinery, techniques and service.
Difference between training and
education.
Training
is for skills i.e. learning to do a particular job in a particular way; To be
this specific about the purpose of training has important consequences: It
imparts a clear focus, leaving little room for doubt in the mind of the trainer
about what is required, thus reducing variation which is essential for
improvement of Quality.
Education
is for development of knowledge. It concerns development, growth and expansion.
There can, therefore, be no categorical definition of what we need to do in
furtherance of education.
Need for understanding of
operational definitions.
A
trainer needs good understanding of operational definitions. Operational definitions
will help the trainer in understanding the job in an unambiguous, clear-cut
way. He must understand and provide operational definitions of relevant
characteristics of the job (such as clean, satisfactory, careful, correct,
attached, tested, level, secure, complete, uniform, consistent, balanced,
vertical, dry, smooth, equal) within the training procedure. If this is not
done the trainees will depart with different beliefs and that particular job
will not get done in a particular way.
Important aspects relevant to
training.
a)
People learn indifferent
ways. Many learn best from illustrations and pictures, others from
demonstrations, some prefer the written word to the spoken, others vice versa.
b)
Once a worker has
brought his work into statistical control, further lessons will not help him
When
the work has reached a state of statistical control it means that the worker's
performance in the particular skill has become predictable. This implies that
he has learnt whatever he could learn and reached a 'stable state' – further
training of the same kind will not make him learn more. Hence if he has learnt
the job wrongly, his performance has become predictably bad and there are 3
options to consider:
a)
Option 1 is to admit that the
system has failed, transfer the worker to a different job and try to be more
successful in training him for that. This sounds drastic and costly but it may
not be more expensive than leaving him on the same job with the almost sure
consequence that he will carry on doing the job badly.
b) Option 2 is to put him
through the same training again. However this would be fruitless – the stable
performance tells us that only common cause variation is present & only
changes to the system itself have a chance of improving matters.
c)
Option 3 is to try him on some different training for the
same skill. This is liable to be difficult and expensive but may be
successful since we are not talking of
training by the same method – training by a different method implies a change
in the system.
Benefits of Training
a) Improvement and
innovation are products of learning.
b) Costs involved are very
small in proportion to the total costs and in comparison with the potential
advantages of the employee knowing his job and doing it well.
c)
Considerable positive un-quantifiable gains due to the
worker gaining satisfaction and pleasure from doing a good job--thus wanting to
continue so doing and improving yet further.
6.7. Point 7: Institute
Leadership of people
Adopt
and institute Leadership aimed at helping people to do a better job. The
responsibility of managers and supervisors must be changed from sheer numbers
to Quality. Improvement of Quality will automatically improve productivity.
Management must ensure that immediate action is taken on reports of inherited defects,
maintenance requirements, poor tools, fuzzy operational definitions and all
conditions detrimental to Quality.
Deming on the role of Leadership:
"In place of
judgement of people, rating them, putting them into slots (Outstanding,
excellent, satisfactory etc), there will be leadership. The aim of leadership
is to help people, to improve the service and profits of the
organisation."
Some attributes of a Leader as
spelt out by Deming in his Seminars.
- A Leader understands
the meaning of a system and how the work of his group fits into the aims
of the organisation.
- He works in
co-operation with preceding stages and with following stages towards
optimisation of the efforts of all stages ( Focus on customers, internal
and external ). He sees his group as a function in a system.
- He understands that
all people are different from each other. He tries to create for everybody
interest, challenge and joy in work. He tries to optimise the education
skills and abilities of everybody to improve. Improvement and innovation
are his aim.
- He is an unceasing
learner and encourages people to learn.
- He is a coach and
counsel, not judge.
- He understands
variation and what is a stable system? What to do about mistakes and
failures of people, how to help them, what to do about accidents and
breakdowns in a stable system is entirely different from action to be
taken in an unstable system. He works to improve the system that he and
his people work in.
- He will study
results with the aim to improve his work.
- He uses his
knowledge of variation to learn who if anybody is outside the system, in
need of special help. Simple rearrangement of the work might be the
answer.
- He creates trust,
freedom and innovation. He is aware that creation of trust requires that
he take a risk.
- He does not expect
perfection and forgives a mistake.
- He listens and
learns without passing judgement on him that he listens to.
- He understands the
benefits of co-operation and losses from competition between people and between
groups
- He creates more
leaders.
- He has 3 sources of
power;
a)
Formal b) Knowledge c) Personality.
A
successful leader develops 2 and 3: does not rely on no.1. He has nevertheless
obligation to use no.1, as this source of power enables him to change the
system – equipment, methods, materials – to bring improvement, such as to
reduce variation in output.
It will be seen from the above
that:
a)
Many fundamental
features of the Deming philosophy are represented in the list – co-operation,
joy in work, understanding of variation and improvement of systems.
b) Each attribute involves
people in an understanding, constructive, sympathetic and humanitarian way.
This is one of the many aspects of his philosophy which makes it so different
from other approaches to Quality improvement. This approach is also evident
from his following quotations :
"A Leader must
understand that the system is composed of people, not mere machinery, nor
activities, nor organisation charts."
And
"A Leader's job is
to help people, not judge them. It is to know when people need special help,
and provide it. He is not a Leader unless he does know."
Need
for Leaders to be proactive in their search for difficulties and in their
desire to help those for ( and to ) whom they are responsible.
Some relevant points:
Time
spent on chasing people, browbeating people to do a proper job etc is a sign of
a low standard of the work environment.
It
is the job of management to develop an environment where workers have genuine interest
in their work and are helped to do it well.
Interest
creates the will to do well and doing it well increases interest--these are
thus complementary activities. Thus a positive cycle must be set up. ( Instead
it is often an opposite negative cycle – Conditions force a worker to do a bad
job; this creates lack of interest resulting in a still poorer job! )
The 5th Century BC Chinese sage Lao
Tzu provides a prescription for Leadership valid in the 21st Century also:
" As for the best
leaders, people do not notice their existence. The next best people honour and
praise. The next the people jeer. And the next , the people hate. When the
leader's work is done people say: 'We did it ourselves.' "
6.8. Point 8: Drive out
fear
Encourage
effective two way communication and other
means to drive out fear throughout the organisation so that everybody
may work effectively and more productively for the Company.
Harmful effects of fear
- It is a barrier to
improvement and innovation and inconsistent with 'joy in work.'
- It is inconsistent
with co-operation. True co-operation with seniors is not possible if fear
exists. Only resentful acquiescence can take place--which cannot result in
much progress.
- It is a barrier to
the scientific approach.
- It sets up barriers
rather than breaking them down.
- It is a weapon in
the armoury of traditional management---an enemy to be blown up &
blown away by the New Philosophy of Management.
- Fear is one of the
biggest obstacles standing in the way of the needed transformation.
Why does fear have the above
harmful effects?
- "Wherever
there is fear, we get wrong figures." Employees in fear of management
learn to provide figures of which the management might approve, whether or
not they reflect the truth.
- Fear thus destroys
the raw material for the scientific approach – hence does not permit use
of the same for improvement.
- Phenomenon of
"Flinching" in inspection – a reflection of the attitude:
"when in doubt, pass it" – occurs because of fear. This becomes
a barrier to improvement.
- In any case, the
aim should be to improve processes so much that, even when anything does
start to go wrong, the safety margin is wide enough to still avoid causing
trouble to customers. But conventional management argues against doing
much better than keeping to specifications with the impression that
"the better it is the more it must be costing us. Consequently
maintenance of production standards is always on a knife edge and fear of
failure is manifest.
- Fear or anxiety
about failure causes us to 'make adjustments' / tamper (i.e. progress
through the rules of the funnel) which is a barrier to improvement.
- Fear inhibits
people from making suggestions for improvement to our work and to the
system in which we work--it might be interpreted as 'trouble-making' or
'criticism.'
- Fear causes stress
and people under stress cannot think creatively, experience joy in work or
innovate.
- Fear of change due
to a feeling of insecurity is a major obstacle to the needed
transformation.
- In a climate of fear
Top Management will be out of touch with reality. They will hear what they
want to hear. Bad news will be withheld, delays hidden, mistakes and
errors buried. Thus opportunities for learning and improvement are
severely impaired.
What should management do to remove fear?
- Do not use
arbitrary targets, rewards & punishments, performance appraisals,
internal competition etc as weapons to generate fear.
- Build two way trust
so that the worker may feel confident of management playing fair by him
and that he is trusted by them and is deserving of that trust. Such trust
is essential for "joy in work" and if joy in work is created
where is the question of any fear remaining?
- Mutual trust,
confidence and respect will nourish "Joint Working
Relationships" which can achieve much more than individual efforts.
- Simplification of
procedures for obtaining permission to take time off work, for claiming
travel expenses etc, for example, can be of considerable help in building
trust.
"The answer lies, I
believe, in a plan by which, under competent leadership, everyone will work on
the changes required, with faith that everyone will come out ahead. Everyone
will help to plan his own destiny."
Or,
more briefly:
"The need is for
everybody to be part of the change, and belong to it."
6.9. Point 9 : Break down barriers.
Break
down barriers between departments and staff areas. People in different areas,
such as Research, Design, Sales, Administration and Production must work in teams
to that may be encountered with products or service.
- This point is
directly relevant to many other aspects of Deming's Teachings such as Work
on the System with an understanding of processes and systems, Co-operation
: Win-Win, Elimination of arbitrary numerical Targets etc.
- Barriers breed
sub-optimisation. Deming has, therefore, described this Point as :
"Optimisation overall, Win-Win – instead of sub-optimisation, by
which each one tries to maximise his own profit."
Deming further points out that one clear symptom of sub-optimisation is
proliferation of paperwork resulting in considerable inefficiency, irritation
and cost.
- The requirement of
"breaking down barriers between departments and staff areas" is
encapsulated in the flow diagram "Production viewed as a system"
which was first used by Deeming in a conference with Top Management in
- It is Top
Management, who erects these barriers through their style and methods of
management and it has to be they who will demolish them. Unlike buildings,
barriers can be built with speed but can only be demolished with care and
patience. In fact, as
- Barriers mean lack
of communication, genuine interest and concern between departments. This,
in turn, substantially weakens the innovative power of an organisation.
Innovation impacts in different ways on many Departments: when the barriers
are up opinions and attitudes in any department are most influenced by how
it affects them – more cost, more risk, more work etc – rather than
focusing on the organisation as a whole and the customer. This produces
results similar to 'Rule 4 of the Funnel' or worse!
- One crucial
difference between Deming-style Management and traditional management is
seen in the way that employees at various levels regard their jobs. Is it
to work for the Company or to maximise their own profit ( Sub-optimisation
), is it to serve the Company and it's customers as well as possible or is
it to "look after Number 1"? It cannot be both.
- The above is
decided by the direction in which the system of management ( including the
system of reward ) guides the employees.
"Can you blame someone for maximising his own profit if he gets
rated that way?"
- One of the biggest
barriers is often that between the Finance Department and the rest of the
Company.
"Too often the finance people in a Company merely beat down costs,
on the thought that any cost is too high. They could make genuine contributions to our economy by
learning the New Philosophy, and by joining in to help to accomplish the
changes that must take place."
- Obsession with
cutting costs leads to poor Quality of work done for the internal
customer, thus overall loss for the organisation. Example of Lady who
wanted to arrive in New York at 7.00 am to meet Deming due to a special
deal negotiated by her Company for a $138 concession on this flight. What
would be the loss incurred by this saving asks Deming? Loss incurred by
her inability to work during the meeting that she was supposed to attend.
"She would have prop her eyelids open with matchsticks in order to
stay awake."
- Finally:
"Breakdown barriers between departments." Why? The example -
"Huge financial advantages of co-operation", answers the
question more eloquently than any more words can!
What should be done by management
to break down barriers?
- Most Companies are
organised functionally. There is a need to operate cross-functionally so
that employees do not feel the need to fight against each other because of
conflicting interests.
- Management should
endeavour to create an environment which fosters co-operation and not
conflict – practice co-operation as a system and an objective (
co-operation should not be incidental ); see that departments have real
understanding and concern for each other. If such an environment is
created then, frequently, minor changes in one department will afford
considerable help to the other – and vice versa.
- The common language
of statistical methods and charting techniques is extremely helpful in
enabling people to gain understanding of each other's jobs and problems
and thus helps in breaking down barriers. These methods and techniques
should be practised.
- Understanding of
processes and systems and use of flow charts will help in breaking down
barriers.
- See that stress is
on "each person doing what is best for the next person down the
line" i.e. the internal / external
customer rather than on fulfilling arbitrary numerical targets.
6.10. Point 10: Eliminate
exhortations
Eliminate
the use of slogans, posters and exhortations for the work-force demanding Zero
Defects and new levels of productivity, without providing methods. Such exhortations
only create adversarial relationships; the bulk of the causes of low Quality
and low productivity belong to the system, and thus lie beyond the power of the
work-force.
- Deming's basic
argument is directed at those who simply exhort others to do better
without helping them to do so. It shows ignorance or disbelief of the fact
that a large majority of the problems lie in the system --the
responsibility of management. Such exhortations as "Take pride in
your work", or "Do it right first time" are degrading to
those prevented from doing so by the system they cannot influence.
- Posters are
sometimes used as a blatant abrogation of management responsibility. For
example,
- "People are
already doing their best – even if you don't believe that do you expect
them to suddenly start doing their best because of such management
gimmicks?"
- The only possible
improvements that can be affected by slogans and posters are those due to
removal of some obvious special causes immediately after start of a
campaign.
- What is needed in
order to improve is help, advice, training and a better system within
which to work – i.e. Leadership of people.
- Are all really all
posters and slogans to be eliminated as per point 10? No, of course not.
Posters and slogans whose genuine purpose is to help advise and
communicate are fine. For example posters that explain to everyone on the
job what management is doing month to month by way of better training, use
of statistical methods etc to improve Quality and productivity – not by
working harder, but by working smarter. Such posters would help boost
morale and are desirable. But, such posters are rare – as Deming says
(page 69, 'Out of The Crisis'), "I have not yet seen any such
posters."
6.11. Point 11: Eliminate
arbitrary Numerical Targets
Eliminate
work standards that prescribe quotas for the work force and numerical goals for
people in management. Substitute aids and helpful leadership in order to
achieve continual improvement of Quality and productivity.
- Deming is not
asking us to manage without numbers – we do need goals, intentions aims
and objectives. But what is not needed is arbitrary numerical goals.
Budgets and forecasts are required for planning and allocation of
resources – but they must also not be arbitrary numerical goals, nor
should they become such.
- Figures in isolation
are not required. Education, training, systems and methods are also
required to make it reasonable for the figures to be attained. If
numerical goals are not met, management must analyse the system.
- Incentive pay
backfires. The salesman whose job is simply to sell as much as he can will
sell a customer a more expensive machine than he needs, or promise to
arrange for delivery immediately, thus making other customers wait longer.
This makes the customers unhappy – they will not come back for repeat business
and will be very committed advertisers against the Company! The Customer
and Company both lose, the salesman being the only likely winner!
- Some apt quotations
on MBR / MBC / MBO:
- "There are
more people measuring productivity than doing anything about it".
- How absurd it is
to think of measuring the effects or results of what we have spent on
- education".
- "Measurements
are always only the tip of the iceberg".
Examples of harm caused by MBO /
MBR /MBC, arbitrary numerical targets, quotas etc.
- One may see any day
in hundreds of factories men and women standing around the last hour or
two of the day, waiting for the whistle to blow. They have completed their
quotas for the day – they may do no more work, and they cannot go home.
These people are unhappy doing nothing. They would rather do work.
- Nuclear plant
averaging 12 serious accidents per year. Top management ruled that the rate
should be halved – aim should be to have 6 serious accidents per year!
Outsiders were brought in to do the dangerous jobs--since accidents
involving no regular employees were not to be included in the records.
Accidents actually increased but fewer were reported!
- Bonus of $300
announced for 'no accidents'. None were reported – but people were seen
hobbling around on crutches or with their arms in slings!
- Some airlines offer
bonuses to mechanics if they get their maintenance and repair work done on
time. Would you like to fly on those aircraft?
- The automatic
forecasting system foresaw a wonderful future on account of the apparent
huge surge in demand – Top Executives decided to buy new plant to cope
with all the new business.
- But what happened
to sales in the following months? The salesmen's mammoth efforts had
exhausted the market. Manufacturing suddenly found themselves with excess
capacity!
- A Company started
an SPC programme and at the same time an incentive pay scheme. It
took about 10 minutes to measure
data, carry out calculations and plot the points. An incentive was
introduced to carry out the operation in 5 minutes instead: The incentive
pay plan rendered useless the attempt to use SPC!
- An electronics firm
typically ships 30% of it's production on the last day of the month--in
order to meet the shipment quota. How? By moving partially completed
instruments ahead of their place on the line, letting Quality standards
slip etc.
- Deming used to show
a headline from a newspaper: "Constable guilty of neglect – failed to
meet quota of arrests". The policeman, in
6.12. Point 12: Permit Pride of workmanship
Remove
the barriers that rob hourly workers and people in management of their right to
pride of workmanship. This implies inter alia, abolition of the annual
merit rating (appraisal of performance)
and of management by objective. Again,
the responsibility of managers, supervisors, foremen must change from sheer
numbers to Quality.
The
annual merit rating (performance appraisal) is the main barrier to pride in
work for people in management. Deming's use of the term covers schemes which
involve the judgement and ranking of people, failing to realise that the large
majority of the variation in performance comes system in which people live and
work rather than from the people themselves. It is objectionable and has
harmful effects in the following ways:
- It is one of the
main constraints holding us back from co-operation: Win-Win.
- It results in
sub-optimisation--people work for their own profits since they are rated
that way.
- It is an example of
'tampering with a stable system' and hence makes things worse.
- It generates and
guarantees fear and is a destroyer of people.
- It smothers innovation
by squashing the excitement and potential of intrinsic motivation. 98
managers out of 100 who do not have joy in work, dare not contribute
innovation because of concern for their rating. It encourages conformity.
- In a merit rating
system the boss becomes the imposed customer while for improvement it
should be the real internal or external customer--the one who receives the
fruits of the suppliers labour.
- It results in
priority of short term over long term thinking. Why should anyone
contribute to the long term benefit of the Company if the short term
reaction is to penalise him for his efforts.
- An individual's own
contribution to his measured performance is very low – more than 5% is
rare according to Deming. Influence of the system contributes a very large
proportion. Ranking people in a system is a lottery.
Some of the barriers to pride in
work for workmen are:
·
Not being sure of what is acceptable workmanship – right
today, wrong tomorrow!
·
Uncertainty regarding
his job.
·
Management not doing anything regarding their problems, They
establish employee involvement schemes but do not take action on suggestions.
·
Long winded, complicated and confusing work instructions.
·
A situation in which inspectors are not sure what is right,
instruments and gauges are out of order and the foreman is pushed from above to
meet a daily quota of numbers, not Quality.
·
Machine is out of order and no one listens to the worker's
plea for adjustment.
·
Supervisor knows nothing about the job and has no intention
to learn.
·
Worker gets poor Quality of material to work with.
6.13. Point 13: Encourage
education
Institute
a vigorous programme of education and encourage self improvement for everyone.
What an organisation needs is not just good people; it needs people that are
improving with education. Advances in competitive position will have their
roots in knowledge.
·
Deming used to say at the start of his 4 day seminars :
"We're not here to learn skills; we're here for education – to learn
theory."
·
Training for skills is finite –it ends when performance has
reached a stable state. In contrast education is knowledge / theory. It is for
growth and that is never ending.
·
One who concentrates on training is the
"practical" man – also defined as one who practices the evils of his
forefathers! But all substantial advances contain much that in the past was
considered too theoretical.
·
It is sheer nonsense to pretend that one can measure the
results / rewards of what is spent on education. Education is priceless, beyond
calculation. Education is vital for improving the future.
·
"Quality Control begins with education and ends with
education.":
·
"Educate your customers, suppliers and the Government
about the need for constancy of purpose, and the tremendous costs of variation
to business and to individuals; develop a better understanding of management in
Government, industry and education."--this is of top priority in
influencing and encouraging the changes which are so needed.
·
When recruiting, look for people who are learning and are
keen to learn, are improving and are keen to improve.
6.14. Point 14: Top
Management Commitment and Action.
Clearly
define Top Management's permanent commitment to ever improving Quality and
productivity and their obligation to implement all of these principles. Indeed
it is not enough that Top Management commit themselves for life to Quality and
productivity. They must know what it is they are committed to – that is, what they
must do. Create a structure in Top Management that will push every day on the
preceding 13 points, and take action to accomplish the transformation. Support
is not enough: action is required.
·
"One of management's jobs is to manage the required
change and to involve everyone in the change."
·
"There's a lot of noise about Quality. But management
are washing their hands of it. Quality cannot be better than the intent.
Quality cannot be neglected."
·
"Quality is made in the Board Room" but "Limitations
on Quality are also made in the Board Room." The Quality of what comes out
of a Company – product and service – cannot be better than the Quality directed
at the Top (Directed, not delegated).
·
"Of course you need good operations, but you can go out
of business making without blemish a product which cannot sell." When
plant's close down it is not because of poor workmanship; it is because what is
being produced (product or service or both) does not have a market. The
responsibility is that of Top Management.
·
Top Management are also in a system, and as in any system,
they too have their suppliers and customers ( the stock market, the government,
the economy, the leveraged buy-out, the unfriendly take-over etc ).
"People at the top
are handicapped in so many ways."
·
True. But they are in positions of high privilege and heavy
responsibility. They, even more so than everybody else in the Company, have a
new job. They must learn it and carry it out. Who else can do it?
·
Management's Job : to learn how to change and to accomplish
the required transformation; it is leadership of people, to help people, to
enable joy in work; it is to improve systems and the working environment, to
optimise systems rather than sub-processes; it is to look for opportunities to
widen boundaries of systems for greater service and profit; it is to focus on
innovation of product and service rather than only improvement, it is to
establish priorities using the Taguchi Loss function, it is to aid and
encourage education, it is inseparable from the welfare of the community; it is
take pride in adoption of the New Philosophy and in their new responsibilities.
Chapter 7: A System of Profound Knowledge
7.1 Introduction
After
It
was around the same time that he was invited to give a talk on Management for
the Future at the
In today’s
world, products and services along with customer requirements have become very
complex. The processes that go into making these products and services have
become even more so. Newer and newer sciences and fields of discipline are
emerging everyday and this has led to the development of two kinds of people –
the Specialists and the Generalists.
The Specialists are people who are masters
of their particular subjects – these are
people who know more and more about less and less. The Generalists are people who are aware of all the sciences, or at
least appreciate the importance and subtleties of the different disciplines –
these are people who know less and less
of more and more. THE SYSTEM OF PROFOUND KNOWLEDGE helps managers of today
and tomorrow to come to terms with dealing and channelling the efforts of these
two types of people resulting in a win – win situation for the organisation.
The problem
with government and industry in the
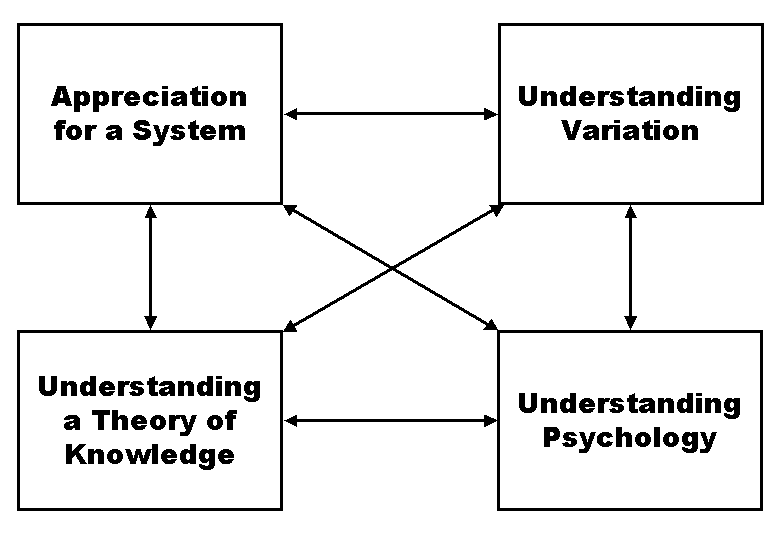
The
SYSTEM OF PROFOUND
KNOWLEDGE
provides an outside
view - a lens
; a map
of theory by
which to understand
the organisations we
live in .
The
System of Profound Knowledge is much like the Bootstrap Theory of Sciences .
·
Appreciation for a System
·
Understanding Variation
·
Understanding Psychology
·
Understanding a Theory of Knowledge
The figure below brings out the
SOPK effectively
7.2 Appreciation for a System
What
is a System ?
All
the components are interdependent – that is not only are they independent but
are also dependent on the other components for their existence . In effect ,
the components not only exist for each
other but also because of each other . We are talking of Man – Made systems
here , so , a system , in an organisation , consists
of an integrated
collection of personnel , knowledge , abilities ,
motivations , equipment , machinery , methods , measures , processes and
tasks . To manage a system – there must exist an aim for the system –
without an aim there can be no system . Without an aim , all the components of
the system are unguided , and , left to themselves , operate independently in a
selfish manner thus destroying the system as a whole . For an organisation –
there must exist an aim and the aim must
not be defined in terms of some specific activity or method but should always
relate to a better life for everyone .
Thus
the aim should be for all the components to gain – over the long term . A
System also includes all the organisation’s competitors as well – so it does
not serve to try to choke your competitor . Instead working with your
competitor to put out better product without duplication of efforts expands the
market making life better for everyone – the Customer , the Organisation as
well as your competitor . The market
then becomes infinite in stead of finite .
Some of the salient points to note
here are :
K1: Appreciation for a system ( people + process
)
· a system is a network of
interdependent components that work together to try to accomplish the aim of
the system
§ interdependence,
cooperation – everyone must gain
§ obligation of a
component is to contribute its best to the system
§ a system
must have an aim, purpose, or mission – a common goal ( P1 –
constancy of purpose )
§ a system includes the
future
· optimisation of the
system is the basis of negotiation
· the whole company, as a
system, must be managed
§ management of a system
requires knowledge of the interrelationships between all the components within
the system and the people that work in it
§ a manager understands
and conveys to his people the meaning of the system (mission and vision) and
how the group supports these aims
§ a manager helps his
team see themselves as components of the system, working toward achievement of
the mission
§ only management can
change the system!

7.3 Understanding Psychology
The
trouble sets in when we as managers or superiors do not understand the learning
process of a person . We must understand the learning process of a person and
improve the process continually. So , the job of a manager or a leader changes
. Not only should we understand how people work together – but we must also
understand how they learn and hone their learning processes that would lead to
them improving . Ranking and grading destroys people’s natural inclination to
learn . They do not do their work because it gives them pleasure – but they do
it to please the boss .
The
Performance Appraisal system acts as a system akin to Quality by Inspection .
People , in a quest of achieving a higher rating , put others down . The job of a manager is not to be a judge –
rather he / she should be a coach and a counsel .
The
only living parts of any organisation are its people. If an organisation wants
to grow – it must allow its people to grow. Enhancement of abilities / capabilities
is one of the prime duties of management. Merely treating workers / staff as
people who are supposed to carry out pre – programmed tasks is an old fashioned
way of managing.
Nowadays,
with the advent of new technology and speedy ways of gathering information, it
is obvious that the customers are
getting more aware than ever before which has resulted in them becoming even
more demanding than ever before.
Organisations
who have to respond to these rapid changes rapidly must have a workforce that
is ready to respond to these changes or even make changes proactively. This is
possible only through continual learning and continual education, which
ultimately leads to continual improvement.
Some of the salient points to note
here are :
K2 : Psychology
· People are different
from one another
§ A manager of people must
be aware of these differences
§ People learn in
different ways and at different speeds
· You can over reward and
remove dignity
· Rewarding only a few
creates competition, rather than cooperation
§ abolish the merit system
in your company; study the capability of the system
§ abolish incentive pay
and pay based on performance
§ give everyone a chance
to take pride in their work
7.4
Understanding Variation
“Variation is the
product of any System…. management’s job is to study Variation, with the proper
theory, to unravel the message that variation is trying to tell us about how to
improve the processes. “
The above sentence was
The central problem in management
is the failure to understand the information in variation. To manage for
improvement, managers need to recognise variation, interpret the messages it
contains about the organisation and act according to the implications of those
messages. In the 1920s,
However , this theory need not be
used only for processes but also to understand people ( as before ) . Most people lie within the “common cause”
region – some lie in the special cause region . This means that there are some
– but only some that perform exceedingly well and some that perform exceedingly
badly . Instead of
reprimanding those that lie on the lower side – we must help them come into the
system ; alternatively , the performers must be studied in order to raise the
level of all the people in the system . This is an important use of this chart but is seldom carried out .
Enumerative and Analytical Studies
Critical to
understanding the applications of statistical analyses in industry is the
distinction between an enumerative study and an analytical study. An
enumerative study is an analysis collected on data from a study on a limited
group or frame. A decision will be made to accept or reject(to buy or not buy)
or to act on the group or frame studied.
An Example of an Enumerative Study
A new supplier
has sent a batch of parts to a plant. The manager must decide to accept (to
buy) or reject (not buy) this single shipment of parts (the material). She has
specifications for the diameter of these parts and she cannot spend time
measuring every part. In this example statistical sampling and analyses are
used correctly to study the shipment (the material). Sample statistics – e.g.,
comparing a sample of randomly selected parts to the design engineering
tolerances for process location and allowable variation – will allow the
manager to make a decision about whether to buy the entire shipment. Most
parametric statistics require the use of a random sample of the material to
describe the shipment in a valid manner.
This example
meets this important assumption. Therefore, most statistical analyses will
allow for prediction of material characteristics from the sample. The sample
could be used to predict and analyse the distribution of the material, conduct
a capability study or calculate confidence intervals on the mean and variance.
The statistical inferences made on the material(or frame) will help to make a
decision on whether to accept the shipment or reject it.
The Analytical Study
An analytical
study is an analysis aimed at answering questions about future material not yet
made. The analytical study is not interested in making a decision on the
shipment but on the supplier. In the analytical study, a decision will be made
on the cause system generating the material.
|
ENUMERATIVE |
ANALYTICAL
|
|
Interest is in studying the group or resources the samples were taken
from. |
A prediction will be made about the process that produces the
resources. |
|
No predictions are made about future resources. |
A prediction will be made about the process that produces the
resources. |
|
The sample was chosen randomly from the resources. |
A decision will be made to change or not change the process that will
produce resources in the future. |
|
Interest is in studying the group or resources the samples were taken
from. |
|
|
A decision will be made only on the resources studied. |
The process will be worked on. |
|
No decision will be made based on the process that generated the
resources studied. |
Document the statistical control of the variables. |
|
Most statistical analyses are valid for inferences on the resources under study. |
Statistical methods of inferences (DOE, t-tests, etc.) are not
meaningful for prediction. If the conditions of the study are repeatable in
the future, then statistical inference may be valid. |
A
control chart can assist in this assessment. If the variable of interest is in
a state of statistical control over many conditions the expert may infer that
the material sampled today will represent material made tomorrow. It is
important to recognise that the validity of an enumerative study aimed at
answering analytical questions can never be known until we can study the
variable of interest under many conditions. The correct number of conditions
that must be studied before the validity of the study is known is also decided
by experts in the subject matter.
Some of the salient points to note
here are :
K3: Knowledge about variation
· Variation is part of any
process
· Statistical Theory should be applied to
management of the system
§ need to determine if the
"system" is stable or unstable
§ variation is predictable
only in stable systems
§ need to set control limits
to predict system behaviour
§ control limits are
calculated limits – not specification limits, arbitrary goals, or quotas
§ a manager understands a
stable system
§ each person's
performance will reach a stable state
§ Half of the people are
always above average, the other half are below average!
§ workers work within a
system that – try as they might – is beyond their control
· Need to separate [even
in your own measurement system]:
o
special causes of variation
§ those variations that
are not part of the system of common causes
§ identify if it can
reoccur and eliminate it
§ can be assigned to
a specific cause (rather than random variation)
§ usually corrected by
someone who is directly connected with the process
§ show up on control
charts as points outside the control limits
o
common causes of variation
§ do not want to react to
common causes (only makes the system unstable)
§ react only to unusual
trends
§ a fault of the system,
usually has to be corrected by management, but often identified by others
§ variations inside the
limits on control charts [from Shewhart]
· Improvement of the
Process...
§ should only occur after
statistical control is achieved in a stable system (with no indication of the
existence of a special cause, over a long period of time)
§ change the process in
attempt to:
§ narrow the variation
§ move the average closer
to the optimum level
§ or both
§ change is tested on a
sample (statistics again)

7.5
Understanding a Theory of Knowledge .
To
put it simply – a theory is
a statement that
relates cause with
effect . However it must
fit without fail
all observations of
the past and
help you predict
the future . The theory in hand
need not be elaborate. It may be a hunch, or a statement of principles. It may
turn out to be a wrong hunch.
Hypothesis
or theory gives us a ground to stand upon; a starting point. A venture into the
unknown could be simplified by establishing a theory and while actually
experiencing the journey the theory would be revised, extended or even
disbanded. The four important points to be remembered here are:
·
Information , though
easily available to
everyone , is not knowledge .
·
Theory is a
statement that relates
cause to effect
and helps us
predict the future .
·
Interpreting
information with the
aid of theory
leads to knowledge .
·
No theory is
wrong - just adequate or
inadequate .
If we
manage our organisations
with the aid
of theories , we can
learn and improve
the systems we
work in . If we
do not have
any theory to
guide us we
tend to copy
examples of success
without really understanding
why or how
the other company
or division really
achieved this success . Sometimes we
look into past
data , draw graphs , and then
extrapolate to set
future targets .
This is
not good management . This is
like driving a
car by looking
into the rear
mirror - you will surely
crash into a wall
! Is collecting and
stratifying past data
wrong ? No it isn't ! It's
just not enough . Instead , if we
were to first
decide what it
is we are
trying to study , collect data
accordingly , stratify the data
accordingly and then
interpret the data
with the aid
of theory , we will
then realise what
we can expect
in the future ! Again , the theory
should be a
statement that relates
cause to effect .
For example
if we come
across an example
of success which
we would like
to implement in
our organisation , we must
first collect data
pertaining to this
example of success , learn how
and why the
success was achieved
and formulate a
theory .
Armed with
this theory , we can
carry out a
small experiment to
test this theory
on a small
scale – maybe in a
single department , a line
of products , a single
process , etc . Since we have
predicted certain outcomes , we
must actually record
our observations of
the “ Experiment ” and
compare the data
to our predictions .
If our
observations matched our
predictions , we can say
that our theory
is adequate . We can
then go for
a full scale
implementation of this
theory and watch
what actually happens
when the theory
is implemented on
a large scale . We
might observe certain
things that we
did not when
we tried out
our experiment . We must
use these observations
as inputs to
the revision , extension or
even abandonment of our theory
and start all
over again .
Alternatively
, if the
outcome of our “
Experiment ” does not
match our predictions , we can
revise our theory
and start all
over again . This
revision of theory
must be cyclic - in
the sense that
we must not
stop once our
theory has been
proved “ adequate ” - we
must keep on
observing and learning
and trying to
prove ourselves wrong
so that we
can gain more
knowledge . In other
words , our improvement ,
revision or abandonment
of theory actually
is increasing our
learning !
K4: Theory of knowledge
· management = prediction
· knowledge is built on
theory, build a hypothesis which:
§ predicts a future outcome
§ identifies risk of being
wrong
§ must fit, without
failure, with the observations of the past
· without theory, we have
nothing to revise, nothing to learn
· there is no true value,
effected by
§ changes in how the
measurements are taken
§ changes in how the
measurements are defined
· information is not
knowledge – a statement devoid of rational prediction does not convey knowledge

As
explained above , the System of Profound Knowledge is a lens with which
I am not here to teach you something new – I am here to make you see
things that you normally wouldn’t see
We will tend to view events differently , view relationships
differently , view interactions differently .
Chapter 8:
Application of the Deming Management Approach
8.1. Examples of application of the Teachings of Deming
Some practical examples of application of
the Teachings of Dr Deming are given at Appendix B. These examples bring out
how Deming's Teachings help us in gaining a deep insight into Various
processes, in understanding of the ground reality and in bringing about
improvements in performance..
8.2.
Control charts can be of great help in
assessing the benefits of improvement efforts and in giving the right direction
to such efforts. The traditional method of comparison between two figures tells
us only a small part of the total story. In fact in many cases it may lead to
very wrong conclusions. The deep understanding and clear guidance provided by
application of control charts in such cases has been brought out in "The
Story of a Traditional Improvement
Effort" at Appendix C.
(Appendix
C to be copied from power point presentation)
8.3. Faulty vs. Better practices of management
The Table below gives some of the faulty practices
of 'conventional' management compared with the 'better' practice as recommended
by Deming:
|
Faulty Practice |
Better
Practice |
|
Reactive: skills only required, not theory of management. Mind not
required. |
Theory of management required |
|
Ranking
, rewards & punishment. Internal competition and conflict which destroys
the system. Ranking comes from failure to understand variation, common &
special causes. Incentive
pay, pay based on performance. Performance
of an individual cannot be measured, except possibly on a long term basis.
Effect of incentive pay is numbers, not Quality. Result: backfire, loss. M.B.O,
management by numbers. ("Do it. I don't care how you do it. Just do
it.") The
Company's objective is parcelled out to various components or divisions. The
assumption is that if every component or division accomplishes it's share, the whole Company
will accomplish the Objective. Unfortunately, because of their
interdependence, efforts of the components do not add up. Setting numerical goals and
quotas accomplishes nothing. Only the method is important, not
the goal. Pressure for goals leads to distortion of the data or the system. The
so called merit system – actually, destroyer of people. Under the merit
system the aim of any body is to please the boss. The result is destruction
of morale. Quality suffers. MBR.
Immediate action on any fault, defect, complaint, delay, accident, breakdown.
Action based on the last data point. PRR (Problem Report and Resolution):
Tampering, making things worse. Work
Standards. They increase costs, rob people of pride of workmanship and are a
barrier to improvement in output. Buying
materials and services at lowest bid. Lack
of constancy of purpose. Short term thinking. Emphasis on immediate results.
Keep up the price of the Company's stocks, maintain dividends. No number of successes in short term
problems will ensure long term success. Failure
to manage the organisation as a system. Instead the various components are
individual profit centres. Everybody loses. Worker
training worker in succession. This is application of Rule 4 of the funnel
i.e. 'just like the last' rule. It causes the 'system to explode in one direction'
and the wrong methods only get magnified! Delegate
Quality to someone, or a group. Appoint someone as the vice-president in
charge of Quality. The result will be disappointment and frustration. |
The whole organisation managed as
a system, the function of each 'Unit' being to contribute towards
optimisation of the system. Abolish Ranking which is a farce
– apparent performance is attributable mostly to the system, not to the
individual. Performance of anyone is governed
almost entirely by the system. Give everyone a chance to take pride in his
work. Organisations and individuals
will, of course, have aims. But the aim should be improvement, not to reach a
number. So, a better way is to improve
the system to get better results in the future. Study the theory of a system.
Manage the components for optimisation towards the aim of the system. One
will only get what the system will deliver. Any attempt to beat the system
will cause loss. Work on improvement of the
process. By what method? Flow charts and the PDSA cycle will help. Judging people, putting them into
slots, does not help them to do a better job.
Change the system from conflict to co-operation: Win-Win. Put all
people under a regular system of increase in pay. Institute Leadership of
people. Understand and improve the
processes that produced the fault, defect etc. Understand variation. The
distinction between common and special causes is especially important in the
leadership of people. Study the system, understand it's
capabilities and improve them. Provide Leadership of people to enable pride
and joy in work. Wherever work standards have been replaced by competent
Leadership, Quality and productivity have gone up and people on the job are
happy. Estimate the total cost of use of
materials and services: purchase price plus predicted cost of problems in use
of them, and their effect on the Quality of final product or service. Do some long term planning. Adopt
and publish a statement of constancy of purpose..
Of course , management must work on short term problems as they turn
up. But it is fatal to work exclusively on "stamping out fires." Ask these questions: Where do we
wish to be five years from now? By what method? Manage the organisation as a system.
A system has an aim. The
individual components strive for achievement of the aim of the system, not
for individual profit nor for any other competitive measure. Everybody wins. A better way is for somebody
competent to do the training.
(Note that we are here talking about training for a skill, not about
education and growth) The responsibility for Quality
rests with Top Management and cannot be delegated. |
8.4. A New approach/methodology for reducing incidence of failures
/ sick marking / out of course repairs etc.
12.4.1. The
old (conventional approach)
In the old / conventional approach
the aim of failure investigation is to find out the root cause(s) of any
failure/problem and take action on the basis of this finding. Most often the effort is to zero down on 1
(or some times 2) causes. The action taken is very often individual action i.e.
the action assumes that there is something special about the particular
loco/coach/wagon or about the persons who have attended it. In some cases, action for improvement of
maintenance practices is also taken.
8.4.2 Drawbacks of the conventional approach
The conventional approach is based on
some wrong assumptions and on lack of knowledge in regard to certain aspects of
'profound knowledge'. The new approach /
methodology overcomes these drawbacks and takes into account the following
knowledge which is ignored in the conventional approach:-
a)Knowledge
of common and special causes – The fact that in any industrial or business
situation 85% to 95% of problems are due to variation which occur on account of
common causes i.e. variation due to 'chance'.
Hence in such cases improvement can be brought about only by improvement
of systems/procedures/practices and not by individual action.
b)In almost
all problems/failures, there is a multiplicity of factors which influences the
failure/problem. The failure/problem
occurs due to a chance combination of these factors. Therefore, for bringing about improvement in
performance, even small improvements in regard to a number of such factors will
be helpful – this will reduce the chances of occurrence of the failure/problem.
c)The
reality of continuous improvement - This means that if we examine the subject
sufficiently in depth there will always be some improvement possible in any
maintenance practice /system /procedure..
d)The
necessity of creating a climate where joy in work and intrinsic motivation flourish so that employees at various levels apply their mind
for bringing about improvement. This
climate is created by creating trust, removing fear and encouraging application
of mind.
e)The
internal customer concept - This means that each unit/person should do what is
best for the next unit/person down the line. Hence the problems should be
prioritised in accordance with the needs of the "internal customer".
8.4.3. Steps to be
taken as per the new approach and methodology
a) Prioritise problems
/failures by interacting with the internal customer and based on analysis of
his records.
b) Take action to eliminate
any obvious special causes.
c) Study the systems /
procedures / practices to bring about improvement as follows :
i.
identification of various factors which influence the
failure / problem.
ii.
Identification of the maintenance practices / systems /
procedures which influence these factors.
iii.
study of the identified practices/systems/procedures to
compare "What is going on ?"
with "what should
be". Inculcate a spirit of continuous
improvement among supervisors close to the job and involve them in study.
d) Create the right environment for intrinsic motivation to flourish by
encouraging people to find out their own mistakes, encouraging application of
mind and bringing about an understanding of continuous improvement.
8.5. Suggested application of knowledge gained
|
Knowledge |
Application
|
|
1.
Common and Special causes. |
·
Identification of type of action based on type of cause. ·
New approach and methodology for solving problems,
reducing failures etc. (as outlined at para 4 above) |
|
2.
Deming's chain Reaction and Deming
Shewhart Theory. |
·
Give Quality top priority – do what is best for next
person / Unit down the line and the following
ones(Internal customers) – and what is best for the final customer, through
the chain of internal customers. |
|
3.
Modern View of Quality vs Traditional view of Quality (Taguchi Loss
function). |
·
Always work for continual improvement towards the `nominal'/
`best' value / performance – not for mere achievement of Specifications,
Standards or Targets. |
|
4.
Limitations of and harmful practices associated with inspection. |
·
Focus on process improvement (not on inspection), as the route
to Quality with the ultimate aim of ceasing reliance on mass inspection to
avoid defects, failures, out of course repairs and customer complaints. ·
Avoid multiple inspections. |
|
5.
Data presentation, interpretation and Reporting. Superiority of Shewhart's
control chart approach as compared to the traditional comparison to specifications / comparison
to averages approach. The
3 stages of Statistical Process control (SPC) as intended by Shewhart: The
immense potentialities of this approach and method for bringing about
improvement at all levels, specially when used in respect of data which lands on the table of the Top
Managers of the Unit / department. |
·
Report and ask for Reports in the form of Control Charts,
instead of the traditional comparisons between two figures. ·
Use SPC & Control Charts for guidance regarding action
to be taken for improvement at all
levels e.g. a)
For performance parameters which are monitored on a daily
/ monthly basis at the Depot / Shed, Divisional & Headquarters levels such as: ineffective
percentage of coaches / wagons, percentage of coaches marked sick, No. of out of course repairs for different
causes in diesel sheds, enroute & secondary detachments of coaches, no.
of cases of brake binding etc. b)
Results of inspection at various stages for different
components, assemblies, coaches, wagons & locos in Workshops and P.Us. c)
Cycle time of repairs of coaches, wagons and Locos in
Depots and Sheds for different types of repairs. d)
Lube oil
consumption and fuel consumption in Diesel Sheds: loco-wise as well as for
the whole shed. |
|
7.
Funnel experiment. |
·
Look for application of rules of the funnel in management
and stop tempering. ·
Instead focus on system improvement.. |
|
8.
Red beads experiment. |
·
Appreciate big role of chance – do not jump to a single
cause as the root cause of a problem. ·
Do not judge people solely on the basis of results. ·
Focus on System improvement. .
|
|
9.M.B.O
, Performance Appraisal and Targets are harmful. |
·
Do not put pressure for targets and objectives – instead
focus on process improvement and help / guidance in improvement. ·
Discuss with employees regarding their performance,
difficulties, improvements being made, plans etc with a view to help, not to
judge. ( Render the bad effects of merit system ineffective by giving bad
C.Rs / superseding very rarely.). do not use C.Rs as weapons to threaten people. |
|
10.
Clear understanding of Quality. 11.Close
relationship between Quality &
management. For "building Quality into the system" changes in
attitudes, systems, procedures and practices are required. 12.
Common traps in dealing with figures: ·
Lack of appreciation of important matters for which
figures are unknown and unknown & unknowable. ·
Wrong use of averages. ·
Misuse of figures for creating fear. 13.
Importance of working on the system with an understanding of systems &
processes, use of Flow diagrams / charts. 14.
The Deming-Shewhart cycle of improvement. 15.
Operational Definitions. 16.
Importance of creating a climate where improvement, innovation & joy in
work flourish and employees become able, willing and enthusiastic to
contribute to the 4 prongs of Quality. 17.
Importance of Co-operation (win-Win) as the backbone of the philosophy and
harmful effects of internal competition. 18.
Huge Financial Advantages of co-operation. 19.
Understanding of Deming's 14 points for management:: ·
As Vehicles for opening up the mind to new thinking and
radically different & better ways of managing the organisation. ·
As goals to be achieved, not the steps to be taken. The
need for creating an environment which is fully consistent with and conducive
to their adoption. ·
In the context of a commitment to continual improvement in
Quality in the widest sense and interpretation. |
Spread
this understanding at all levels. Do
not regard 'Quality' as the job of inspection or the Q.C. Department. Management
at all levels should take action to 'build Quality into the system'. Take
action to improve in such matters e.g. Employee
morale, enthusiasm and joy in work, customer loyalty etc. Do
nor judge and act on basis of averages alone. Do
not threaten people in connection with achievement of targets. Construct
valid flow charts to understand
the system and improve it. Co-ordinate
activities to optimise whole system. Judge
contribution on basis of contribution to aim of the system not individual
production or profit. Give
importance to the real customer as seen from the flow chart rather than
imposed customer (the boss) as seen in hierarchy diagram. Use
this cycle for planning and carrying out improvement efforts. Use
operational definitions for reducing variation by: ·
Clearly specifying the work. ·
Defining procedures. ·
Identifying needs of internal & external customers. ·
Stop de-motivating people by faulty practices which
destroy joy in work. ·
Concentrate on generating joy in work. One
important way this can be done is by removing fear & creating systems
which give a chance to people to apply their minds towards improvement &
innovation. ·
Learn to practice co-operation as a system, a principle, a
strategy and an objective--not incidental or an accident. ·
Provide Leadership which nurtures teamwork. Form teams so
that people on a job have the privilege of working together with people in
the preceding and following stages as a team for the common aim of the
system. ·
Remove manifestations of the Win-Lose philosophy which hold
us back from co-operation, vis managing departments in a system of
competition, merit rating, performance appraisal, MBO, MBR, stress on
arbitrary numerical targets etc. ·
Extend 'All one Team' outside the organisation to
suppliers & customers. ·
Co-operate with competitors (Road Transport, for example)
for mutual benefit. ·
Educate management at all levels in regard to these
advantages. Form
Teams from different departments / Units / work Areas. These teams should
identify different options and their effect
on different areas. Adopt those options which give maximum net benefit to the
Organisation. Take
necessary steps in regard to each of these points in accordance with this
understanding. Much of what is written above will constitute the steps to be
taken. |
8.6. A Railway Example
Data regarding coach and wagon
ineffective percentage for one of the Railways was obtained for a 5 year period
and control charts prepared. Notes at Appendix D bring out the Objective, methodology
and interpretation of these control charts. The further line of investigation
to be followed by the Railway concerned, that will lead to actions for
improvement in performance has also been indicated--this is based on interpretation of the control charts, as
given in the 'Note'.
Appendix
A
Transformation and
the five deadly diseases
(In the words of
"There
must take place in the Western world a transformation. So many people are at
work on productivity – so they say. They're not working on productivity at all:
they are working on how to measure it! The thermometer here might read 108 F –
blistering hot. But the thermometer does not do anything about it--it just
tells the problem. It's time that people do something about it. But Management
cannot when they know not what to do. Most do not know that there is a problem
or that there's anything they can do. It's always for someone else, improvement
is for somebody else."
"Disease
number 1 is lack of constancy of purpose to stay in business by providing
service and product that will have a market in future. I see it in the work that
I do – with hospitals, motor freight, railways, manufacturing, department
stores. People have not decided what it is that they are in business for. They
really don't know. Do you define it in terms of service: to produce product and
service that will have a market of the future? Or is it just to have jobs – get
paid, have jobs, live a little while, maybe get into something else? Lack of
constancy of purpose means short term thinking."
The above describes
Deadly disease no1: Lack of
Constancy of Purpose
·
No planning for the
future.
·
Lack of long term
definition and goals.
"The
2nd deadly disease is emphasis on short term profits, short term thinking.
Dividends, no matter what. Creative Accounting. Shipping stuff out no matter
what. Make it look good. Devastating to long term planning with a plan to stay
in business through improvement of Quality of product and service. They cannot
live together. American Management has worshipped the quarterly dividend.
They're rated on price of the company's stock. Acquisition, creative
accounting. There is a better way. A better way to protect investment; and that
is with plans that will keep the company in business and provide jobs and more
jobs. Unemployment is not inevitable. Unemployment is a sign of bad management,
loss to market."
The above describes
Deadly
disease no.2: Emphasis on short term profits.
·
Worship of the quarterly
dividend
·
Sacrificing long-term
growth of the Company.
"A
third deadly disease is the annual
system of rating salaried people, known also as merit system, annual appraisal
of performance, annual rating of performance, known also under the name
"management by objective." Someone in
Now
the effect is devastating. People have to have something to show, something to
count. In other words, the merit system nourishes short term performance and
annihilates long term planning. It annihilates team work: people can't work
together. To get promotion you have to get ahead. By working with a team, you
help other people. You may help yourself equally but you don't get ahead by
being equal: you get ahead by being ahead – produce something more, have more
to show, more to count. Whereas teamwork means work together, hear everybody's
ideas, fill in for other people's weaknesses, acknowledge their strengths, work
together. This is impossible under the merit rating, review of performance. For
people are afraid. They're in fear, they work in fear, They cannot contribute
to the company as they would wish to contribute. This holds at all levels.
There's
something worse than all that. When the annual ratings are given out , people
are bitter. They cannot understand why they are not rated high. And there's
good reason not to understand, because I could show you with a little time that
it is purely a lottery. Now if it was recognised as a lottery and called that,
then some people would be lucky and some unlucky, They'd at least understand
the system, and some people would not feel inferior and others would not feel
superior."
The above describes:
Deadly Disease no.3:
Annual Rating of Performance
·
Arbitrary and unjust
system.
·
Demoralising to
employees.
·
Nourishes short term
performance.
·
Annihilates team work.
·
Encourages fear.
"This
annual rating encourages mobility of management. Somebody does not get the top
rating, which means a raise: he looks around for another job. The fourth deadly
disease is mobility of management. People moving around, not having roots in
the company, not understanding the Company. Just trying to bring in some
abilities, learn some more, move along. Management requires knowledge of the
company, requires roots in the Company……..Takes a long time…………People in
Management to-day know nothing about the problems of anybody else; they don't
even know their own.
The above describes :
Deadly disease no. 4:
Mobility of management.
·
No roots in the Company.
·
No knowledge of the Company.
·
No understanding of it's
problems.
"The
fifth deadly disease is use of visible figures only for management, visible
figures only with little or no consideration for figures that are unknown or
unknowable. Now you may ask me: "Well, why do you talk of figures that are
unknown? If it's unknown how do you know that it's important?" Well ,
let's have a look at some of the unknown and unknowable figures. Very simple.
One of them is the multiplying effect of a happy customer. How much business does
a happy customer bring in to you? Nobody knows. ….
What
about the multiplying effect of an unhappy customer that drives business
away?…..
I
don't see the figures. They're very important. He that runs the Company without
them will have no Company. Schools of Business have done their work. They're
not teaching transformation. They're teaching use of visible figures, creative
accounting, how to maximise the price of the Company's Stock by keeping up that
quarterly dividend."
The
above describes:
Deadly disease no.5: Use
of visible figures only
·
No use of figures that
are unknown and unknowable.
·
Encouraged by Business
Schools.
Appendix B
The Deming of
The
following are
The
introduction describes Deming's influence in
D: I did not export American
practice. I took to them new knowledge, philosophy of management, theory
of management, which is optimisation of a system whereby everybody gains.
Everybody gains. The Japanese man, executive or otherwise, is never too
old or too successful to learn. He is eager to learn and to listen.
It is not hard for him to change because he understands the system, that he is
part of a system and the job is to optimise the system.
D: It is only
management that breaks out of the system that makes impact.
PP: Management that
breaks out of the system? Tell me what you mean.
D: Optimises the
system, for example. Instead of doing it the way we've always done it, to
do what is best for the whole system.
PP: Could we talk
about optimisation?
D: An orchestra is
an example that most people can understand, a system. Everybody there is
supporting all the other players. 140 piece orchestra, everybody supports
the other 139. He's not there to play a solo. He's not to play as
loud as he can play to attract attention.
He's there to support the other 139. The job of the conductor is
to optimise their talents, their abilities.
D: Ever hear of a
bank that failed?
PP: Yes.
D: Do you think it
failed because of mistakes, sluggishness at the teller's windows?
Mistakes in calculation of interest? Mistakes in bank statements?
Don't be silly. All that could go off without blemish and the bank would
fail. Purely a matter of management. A manager is a leader.
Should be. He understands how he, his work, and the work of his people
fit into the system, for optimisation of the system. That's the first job
of the leader, to try to find, recognise that all people are different.
Try to fit each one into what he can do best. Takes joy in learning, in
helping to improve. He's coach and counsel, not judge. You judge people, you shut them up.
They don't talk.
PP: What happens in a
system when you ask someone to achieve a result that's impossible to achieve?
D: Everybody
suffers. He'll make it happen, by destruction of the company or
impairment in some way. He'll make it happen. And we all lose.
Anybody can accomplish anything if we don't count the cost.
PP: When you set up a
system that makes the individual, that puts the individual in an impossible
situation, then he's going to do what he has to do?
D: If that's his job,
he'll make it happen, by fudging figures or by destroying the company.
Can you blame him? That's his job.
PP: So, you're saying
that the component of the system is really responsible for the larger whole,
for the benefit and good of the larger whole?
D: That is a good
way to put it. A component, any group, anybody, is to be judged by his
contribution to the system, not for his individual profit or gain, in sales or
anything else.
D: We've grown up on
short term thinking, short term planning. Profits now, high dividends,
churning money. Impossible to advance under such forces.
D: Well, people,
given a choice, be thankful we do have a choice, they buy the imported product
many times in preference. And our products do not sell in other parts of
the world. There are exceptions, great exceptions. Aircraft
industry has 70 percent of world's business.
PP: I asked
D: How could
they? All they ask is a chance to do a good job, to take pride in their
job and be proud of the company. That's all they ask for.
PP: This worker can't
make that product better unless the system is changed?
D: He can only make
what he's asked to do, under the difficulties that he meets, with poor
materials, equipment that doesn't work, all sorts of problems.
PP: Workers in this
country have been blamed for a number of years, saying that they are lazy and
that they don't want to work and that they don't care and they're not producing
quality and that they are not doing it right and that's why our automobile
industry went down and that we have to change our attitudes as people. Is
there any truth in that at all?
D: Not a bit.
PP: Not a bit?
D: Not a bit.
PP: Not a bit?
D: Absolute
nonsense. We'll get nowhere as long as people think that.
PP: Factory workers
always have a question when they hear about Deming. They want to know,
are you against unions?
D: Against? Of
course not.
PP: Good, I'm glad to
hear you say that.
D: Unions are a part
of the system, a very important component in the system.
PP: Now, what's been
the problem then as people have dealt with unions?
D: Failed to
understand the system, that's the problem.
PP: So, we have
people pitted against each other, union and management, rather than saying this
is the whole system which must be managed?
D: Optimisation of a
system should be the basis for negotiation between management and labour,
between buyer and seller, with suppliers of the company, between
countries. He who goes into negotiations to defend his rights is already
licked.
PP: What do you mean?
D: It should be
optimisation of the system by which you gain more than any other way.
PP: So, if I'm going
in, I'm thinking only of my own self-interest, I'm a factory worker and I want
a higher wage .
D: You're a country,
You're anybody.
PP: Or I'm a country,
or I'm anybody and I'm thinking only of myself and not thinking of the total
system and I'm going to lose?
D: Defend your rights,
you lose.
PP: How do the people
without power, how do they not be taken advantage of? Everybody is not of
good will.
D: Purely a matter
of understanding. He who is in power must understand the system.
And the best solution is for everybody to win.
Everybody to gain. No losers.
PP: It's so foreign
to us. It is not what we've been taught. It's not what we've done.
D: Economists have
led us down the wrong road. They've taught us adversarial competition is
a solution. It is not. Worrying about share of market, trying to
choke your competitor. Spend your time that way instead of working on the
product, to develop a better product.
PP: So what do you do
instead of compete for share of market?
D: Expand the
market. Put out better product.
PP: It's a different
philosophy. It's as if we are saying there is a finite amount versus an
infinite amount here.
D: I think that's a
good way to put it. People make the supposition that the market is a
finite amount and the successful companies have taken the other point of view,
that the market is expansible. By paying attention to the future needs of
customers, they expand the market.
PP: So you don't
worry so much about being an adversary to your competitor, you worry about
what? Continual improvement of your own product and getting something
better out there and looking to your own system to enhance it?
D: That's right,
that's right. That helps both people you and your competitor. It's
just a law of nature. He who spends his time worrying about his
competition, worrying about his share of market is already licked. If you
have any stock in that company, you'd better sell it. Competition is part
of the system and any competitor who improves his product improves the market,
helps his competitors. And the worse thing that can happen to you is to
have a lousy competitor.
D: Customer doesn't
know what he wants. He makes a choice. He does not see his future
needs. Customer's expectations are only what you and your competitors
have let him to expect. He is a rapid learner, but he does not foresee
what he might need. No customer asked for electric lights. No
customer asked for photography. No customer asked for telephones.
PP: How has the
prevailing style of management crushed innovation?
D: By ranking
people. It starts with grading in schools, from toddlers on up, through
the university. Grade, ranking people, making top people scarce, only so
many A's allowed. It is not a game. In playing tennis, a beauty contest,
horse race, play poker, it's a game. Somebody wins. We knew that before we started.
Perfectly all right. I have nothing against it. But management is
serious, education is serious.
PP: But we are so
used to in this country to ranking people, to being ranked ourselves and those
of us who want to achieve always want to make sure we rank at the top in
whatever system we are in. It's just counter to our usual thinking, and
even I get a little scared when I think but what would happen if you weren't
evaluated or ranked? How does it work? If I'm not going to be
ranked will I be rewarded for the results that I produce?
D: You want reward?
PP: Yes.
D: You want
reward? The reward you want is pride and joy in your work. That's
what you want.
PP: Yes, you're
right, that's the first thing.
D: There's nothing more to
ask for.
PP: But I also want
money sometimes.
D: Pay is not a motivator.
PP: Sometimes .
D: No.
PP: No?
D: No. Pay is
not a motivator, sure you have to have enough to live on, and to live
right. Beyond that, pay is not a motivator. Remember
PP: What is an
alternative? What can they do instead?
D: To help. To
coach and to counsel, to help and optimise. Don't judge. We need to
develop self-esteem, dignity, joy and pride in work so that people may be
innovative and contribute their best to the job. If we destroy them, they are
humiliated. Ranking them destroys them.
PP: The question is:
are business leaders really taking the responsibility which is theirs?
Are they educating themselves that they need this and don't admit it to
themselves?
D: They don't know
about it. How could they admit when they don't know about it? But
how could they know? How could they know there was anything to
learn? How could they know? How could they have any suspicion that
there is anything to learn? How could they?
PP: Well, I think they
should know.
D: How could
they? How could they?
PP: They ought to
know.
D: How could they?
D: How could
they? Themselves . Profound knowledge comes from the outside, never from
the inside, must come from the outside and only by invitation.
PP: When you say that
knowledge must come from the outside, what do you mean? I don't quite
understand it.
D: You ever find it
inside the company?
PP: Well, sometimes,
some parts.
D: Have you?
PP: Some parts.
D: Have you?
PP: You're talking about
profound knowledge?
D: Yes.
PP: Or you're saying
that knowledge.
D: Yes.
PP: Profound
knowledge?
D: Yes, profound
knowledge, knowledge about a system.
PP: Why is
that? Why can't it come from inside the company? What do you think is
going on?
D: Everybody is
doing his best, with the greatest, the best of intentions, everybody working
hard at doing what is wrong, not guided by a theory of management.
Reactive behaviour, managing by results. Sure we want good results.
Manage by results, quality goes down, morale goes down. Management has
not a theory of management. They work hard, very hard, under terrible
stress that I could not endure. Best efforts, hard work, our ruination.
PP: And you're
talking about CEO's and presidents and vice presidents and all other people who
are in charge .
D: Government
people, people in education.
PP: And we're missing
it somehow, we're missing the real point?
D: Pretty
obvious. Deming's Second Theorem: We're being ruined by best efforts and
hard work, doing what is wrong.
PP: What are they
missing?
D: Theory of
management.
PP: So, how can we
tell them? How can we tell them they need to listen to this? How
can we get the message out?
D: A physician can
do nothing for somebody who does not acknowledge he needs help. First
step, he must ask for it.
D: Our education is
failing.
PP: What are we doing
that we should be not doing?
D: We just don't
educate, people, youngsters. We grade them but don't educate them. Don't
teach them to think.
D: Our worse thing
is, failure to understand what learning is. For example, experience
teaches nothing. The fact is, there is no experience to record without
theory. Theory enables us to ask questions, to learn. Without theory
there is no learning.
PP: That was a really
hard one for me. When I first met you .
D: Why should that
be hard?
PP: Well, because
that's not what we're taught. We're taught to look at an example and say,
I see, I'll do that, that's the right thing to do. But .
D: But that's their
downfall. People copy examples and they wonder what's the trouble.
They look at examples and without theory they learn nothing. Theory leads
you to questions.
PP: For a while people
thought they had the answers about the problem of quality and they went through
all kinds of things such as quality circles and a number of other methods which
they saw working for the Japanese. Why do you think those didn't last?
D: That's all window
dressing. That's not fundamental. That's not getting at change and
the transformation that must take place. Sure we have to solve
problems. Certainly stamp out the fire. Stamp out the fire and get
nowhere. Stamp out the fires puts us back to where we were in the first
place. Taking action on the basis of results without theory of knowledge,
without theory of variation, without knowledge about a system. Anything
goes wrong, do something about it, overreacting, acting without knowledge, the
effect is to make things worse. With the best of intentions and best
efforts, managing by results is, in effect, exactly the same, as
PP: I asked
PP: How did you feel
when he gave that to you?
D: Felt unworthy.
PP: You felt
unworthy?
D: Yes.
PP: Why?
D: It was a matter
of luck.
PP: I asked about
another medal from our president.
D: Oh, the medal
from the President of the
PP: Are you anxious
to get back to work?
D: No, I'm just
desperate, that's all, absolutely frantic.
D: Management's job
is optimisation of the whole system. Decide what constitutes the system,
certainly customers, suppliers, employees, stockholders and the welfare of
employees, their education, their chance to improve skills and education, their
chance to have a little time at home and not work too hard. Their chance
to learn good management so they can contribute to their clubs and churches and
schools. Our schools need it sadly. Optimisation would mean
teaching everybody so they may help other people. Optimisation of the
whole system, everybody gains, no losers.
Appendix C
Control Charts : A Railway
Example
Notes on control charts prepared by
IRIMEE based on data for coach and wagon ineffective percentage obtained from
one of the Railways.
1. Background:
Study
and analysis of control charts of important performance parameters (based on a
time-series graph) can give useful guidance on the type of action which needs
to be taken for bringing about improvement in performance with respect to the
particular parameters. With a view to prepare such control charts, data for
some of the important performance parameters pertaining to the Mechanical
Department of S. E. Railway was obtained from CME of the Railway by
In
this note the control-charts prepared for 2 of the parameters (viz. Coach and
wagon ineffective percentage) have been analysed and discussed. This analysis
raises some relevant questions which have been brought out in the note.
Investigations and enquiries will need to be made at the field level to find
out the answers to these questions. These answers will, in turn, give us
guidance regarding the Action to be taken by the Management of the Railway, at
various levels, for bringing about improvement in performance in regard to
these parameters.
2. Objective:
The
final objective of making the control-charts, studying, analysing and
interpreting them and making further investigations (based on this study,
analysis
and interpretation) is to find out what actions should be taken by the Railway
to bring about significant reduction in the coach and wagon ineffective
percentage.
The
control-charts will enable us to achieve the above objective by helping us to
find out the underlying reasons for variation between individual values or sets
of values---i.e. enabling us to distinguish:
a)
Whether the values form part of the same system, the
variation being 'not significant' and due to nothing but chance (common
causes)--in which case only changes in systems / procedures / methods /
practices will reduce such variation.
Or
b)
Whether the variation in the values are 'significant' and
occur due to special causes outside the system---in which case further
investigations have to be made to find out what exactly are these special
causes. In such cases variation will reduce only by action to eliminate the
special causes.
Or
c)
Whether any two sets of values are significantly different
or not i.e whether they represent two different systems or whether they are
part of the same system. If the answer is in the affirmative then further
investigations need to be made to determine how exactly do the two systems
differ from each other. Action required for bringing about improvement will have
to be decided based on the results of these investigations.
3.
Methodology-preparation of control charts at Annexures 1-A and 2-A.
a) On the basis of the figures for
ineffective percentage for each month, tabulate the 'moving range values' i.e.
the mR values. The mR value for a particular month is the absolute difference
between the figure for that month and the figure for the previous month. E.G.,
the mR value of ineffective percentage for May 1995 will be the difference
between the figures of ineffective percentage for May and April 1995.
b) Construct a control chart for
individual values (X chart) and one for moving ranges (mR chart) one below the
other as follows:
·
X Chart.
Make a 'time-series graph' showing the figures for ineffective
percentage month-wise from April 1995 to September 2000. The average, upper
control limit (UCLx) and lower control limit (LCLx) for this chart are calculated (and plotted as straight lines on
the time-series graph) as indicated
below :
- Average (X) = average
of the 12 values from April 1995 to
March 1996.
- UCLx = X + 2.66*R.
- LCLx = X - 2.66*R
where
R is the average of the moving range values from May 1995 to March 1996 and X is
the average of the individual values from April 1995 to March 1996.
(
Question: Why have we considered only the first 12 values from April 1995 to
March 1996 for calculating the average
and the limits? )
Answer : There is no hard and fast rule to decide
what values we should consider for
calculation of the average and the limits. It will depend on what is the type
of inference we are looking for from the control chart. In this case we are reviewing the performance for the last
5 years and one of the important
inferences we would like to derive is to understand what variation have taken
place in the ineffective percentage,
with reference to the first year of the 5
year period--taking the same as the 'base year.'
Calculation of average
and limits based on the 12 values from April 1995 to March 1996 will be helpful
in arriving at this understanding).
Longer the period, variation would
get ‘averaged’ over longer period. Since the objective is to effect
improvements in monthly values in a year, averaging data over longer period
would hide signals that would normally prompt the type of action to be taken.
If the data available is for shorter duration, we could start by drawing
control-charts based on a minimum of 5-6 figures.
·
mR Chart.
Make a 'time-series graph' showing the mR values from May 1995 to
September 2000. The average ( R ) and upper control limit (UCLmR) for this
chart are calculated (and plotted as straight lines on the time-series graph as
indicated below:
_
#
R = average of the mR values from May
1995 to March 1996.
_
#
UCLmR = 3.27*R
The
X chart and mR chart prepared as per above methodology for coaching ineffective
percentage are at Annexure 1-A. Similar charts for wagon ineffective percentage
is at Annexure2-A.
4. Interpretation of control charts
at Annexure 1-A.
It
is seen from the X chart that from April 1996 to July 1998 i.e. for 28
consecutive months all the figures for coach ineffective percentage remained
below the average line i.e. below the average figure for the period April 95 to
March 96. This means that during this long period of 28 months the performance
was significantly better than in the first 12 month period from April 95 to
March 96. It will be worthwhile to ask the question 'why was this so?'
Again
we see from the X chart that 8 consecutive values from March to October 99 are
also at or below the average line. This means that performance during this
period was also significantly better than either in the first 12 month period
or in the last period from November 99 to September 2000. Investigation of the
reasons for this better performance may give us some worthwhile clues regarding
what needs to be done to improve performance in the future.
Thirdly
we also see from the X chart that for 7 consecutive months from March 2000 to
September 2000 all the values are at or above the average line. This means that
the performance during this period is significantly worse. The reason for this
being so also needs to be investigated.
It
is seen from the mR chart at Annexure 1-A that all the values are well within
the upper control limit. This means that there are no significant month to
month variation which need investigation.
5. Methodology: Preparation of
control charts for coaching ineffective percentage at Annexure 1-B.
It
is clear from the X chart at Annexure 1-A that in the year commencing from
April 96 there was a different (and perhaps better) 'system' in operation as
compared to the 'system' in operation in the previous 12 month period. We would
like to know how much was the difference, quantitatively i.e. what was the
average value, the upper and lower control limits of this system. We therefore
calculate the average value and the limits based on the figures from April 96 to
March 97 and redraw these lines on the X chart--portion BC of the X chart at
Annexure 1-B.
Now
with reference to the 'new system' prevailing from April 96 onwards (portion
BC) we find that 10 consecutive values from August 98 onwards are above the
average line. This means that the performance after August 98 has significantly
worsened. In order to ascertain what is the quantitative difference we again
calculate the average value and the limits based on the figures for the one
year period from August 98 to July 99 and draw these limits--portion CD of
Annexure 1-B, representing a system again different from the earlier system
represented by BC.
Now
with reference to the system prevailing from August 98 (i.e. portion CD) we
find that 14 consecutive values from August 99 to September 2000 are at or
above the average line. This means that the performance after August 99 has
further worsened. In order to ascertain what is the quantitative difference we
once again calculate the average value and the limits based on the figures for
the one year period from August 99 to July 2000--portion DE of Annexure 1-B,
representing a system different from the earlier system represented by CD.
We
thus get the X chart at Annexure 1-B and the corresponding mR chart below.
6. Interpretation of control charts
at Annexure 1-B.
Study
of the X chart in chronological order indicates that during the 5 year period from April 1995 to September 2000
there have been 3 system changes and during this period 4 different systems
have prevailed as follows:
System. From To Average UCLx LCLx
ineffective%age
It
is clear from the above that the performance during the period April 96 to July
98 was the best and very significantly better than either the current
performance (September 2000) or the performance during April 95 to March 96.
It
is worthwhile to investigate why the performance has varied as indicated above.
7. Line of
investigation and study to be followed by the railway concerned that will lead to
actions for improvement of performance: The following questions need to be
answered by observation, study of records and analyses of field – data –
* What were the reasons
for markedly better performance (lower ineffective percentage)
during the period from April 96 to July 98 ? There appears to be a combination
of factors that led to this continued improved performance. The ‘favorable’
factors have to identified and again brought into the system.
* There appear to be favorable special causes
during May 99 and June 99 that resulted in marked improvement in performance,
thought temporarily. It may be due to some causes that may have come into play
even a month or two earlier and may have affected the performance only later.
Thus we must find out what were these causes so as to make them happen more
often and bring them into the system itself for continued improved performance.
* What were the special cause that prevailed
for a long time (and thus become a part of the system) and adversely the
performance during the period August 98 to July 99?
* Further line of investigation could be to
find out as to which depots have contributed most to the improvement
deterioration in performance? Cause-wise analysis of sick marking could further
help in identifying the causes. Do they relate to any significant changes in
the management personnel (Officers, Supervisors)? Any significant changes in
the material (particularly wheels) supply position or procedure? etc.
Wagon
Ineffective Percentage
8. Interpretation
of control-charts at Annexure 2-A.
It is seen from the
X-chart that from June 1996 till the very end of the date, all the figures for
Wagon ineffective percentage remained above the average line i.e. above the
average figure for the period April 95 to march 96. This means that during this
long period the performance was significantly worse than in the first 12 month
period from April 95 to March 96. It appears that a different system started from
June 1996.
It is seen from the
mR-chart at Annexure 1-A that the values of mR for the months Sept 95 Nov 96,
Jan 97, Feb 97, Apr 99, Sept 99, Aug 2000 and Sept 2000 (a total of eight
points) are beyond the upper control limit (UCLmR). They indicate
that the month-to-month variation at these points are beyond the normal
variation due to the system, and deserved to be investigated.
However, since the
entire X-chart beyond Jun 96 is apparently from a different system, fresh chart
needs to be plotted for different periods.
9. Methodology: Preparation of control
–charts for wagon ineffective
percentage at Annexure 2-B
It is clear the X-chart
at Annexure 2-A that in the year commencing from June 96 there was a different
‘system’ in operation as compared to the ‘system’ in the operation in the
previous 12 month period. We therefore, calculate the average value and the
limits based on the figure from June 96 to May 97 and redraw these on the X
chart –portion BC of the X chart at Annexure 2 B.
Now with reference to
the ‘new system’ prevailing from June 96 onwards (portion BC) we find that all
the value from May 97 till Oct 99 onwards are above the average line. This
means that the performance after May 97 has significantly worsened ever when
compared to an already deteriorated system indicated by portion BC. In order to
ascertain what is the quantitative difference we again calculate the average
value and the limits based on the figures for the one year period from May 97
to April 98 and draw these limits- portion CD of Annexure 2-B, representing a
system again different from the crawlier system represented by BC.
Now with reference to
the system prevailing from May 97 (i.e. portion CD) we find that more than
& consecutive value from November 99 to July 2000 are below the average
line. This means that the performance after November 99has improved somewhat.
In order to ascertain what is the
quantitative differences we once
again calculate the average value and the limits based on the figure for the one year period
from August 99 to July 2000- portion DE of Annexure 2-B representing a system
significantly different from the earlier system represented by CD. We have
taken only 9 value because it appears that the value for August ‘2000’ is under
the influence of some special cause. This is also indicated by the mR chart
explained below.
We thus get the X chart
at Annexure 2-B and the corresponding mR chart below.
10.
Interpretation of control chart at Annexure 2-B,
Study of the X chart in
chronological order indicates that during the 5 year period from April 1995 to
September ‘2000’ there appear to have been three system changes and during this
period four different system have prevailed as follows:
System. From To Average UCLx LCLx
Ineffective
![]()
It is clear from the
above that the performance during the period April 95 to May 96 was the best
and very significantly better than performance at any other time.
It is worthwhile to
investigate why the performance has varied as indicated above.
11. Line of investigation and study
to follow by the railway concerned that will lead to action for improvement of
performance. The following questions need to be answered by observation study
of records and analyses of field- data-
·
What were the reasons for markedly better performance (lower
ineffective percentage) during the period from April 95 to May 96 ? There
appears to be a combination of factors led to this continued improved
performance. The ‘favourable’ factors have to identified and again brought into
the system.
·
For about one year from June 96 the system appears to be in
turmoil with a lot of changes coming in. This has caused increased variability,
and deterioration in average performance. It would be worth being worthwhile to
investigate why this happened so that preventive measures could be taken.
·
The system seems to have stabilised at a different level
(with worse performance) from May 97 and continued for more than two years.
There appears to be a combination of factors in the new system that has
contributed to this deterioration. What were these factors? If we could find
answer to this question, it would help improving the system.
·
The system appears to have changed again from Nov 99 with an
improved average but increased variability. What new factors came in around
this to cause this change?
·
There appears to be some special influence on the system in
August 2000. It would be possible to find out what new factor (adverse) has
come up around August 2000. It would be worthwhile to investigate this special
cause.
·
From the mR chart at Annexure 2-b, special cause are
indicated in September 95 April 99 September 99 and August 2000. Out of these,
the last point is common to that indicated by. X chart and deserves through
investigating. At other points too the system has thrown up possibility of
special causes. Investigating to find out what special causes were there would
help in improving the system.
·
Further line of investigation could be to find out as to
which depots have contributed most to the improvement/deterioration in
performance? Cause-wise analysis of sick marking could further help in
identifying the causes. Do they relate to any significant changes in the
management personnel (Officers Supervisors)? Any significant changes in the
material (particularly wheels) supply position or procedure? etc.
Method of making control-charts in MS Excel
|
Data for …for location... |
||||
|
Period |
|
Feb |
Mar |
Apr |
|
X |
(value) |
(value) |
(value) |
(value) |
|
|
(for first 12X) |
(=cell on the left) |
(=cell on the left) |
(=cell on the left) |
|
UCLx |
= |
= |
(=cell on the left) |
(=cell on the left) |
|
LCLx |
=Max (Avg X-2.66* |
(=cell on the left) |
(=cell on the left) |
(=cell on the left) |
|
mR |
Avg mR,0) |
=difference between value of |
=difference between value value of Feb and Mar |
=difference between value value of Mar and Apr |
|
Avg mR |
|
(for the first 11mR |
=cell on the left |
=cell on the left |
|
UCLmR |
|
=3.27*cell above |
=cell on the left |
=cell on the left |
In case system changed is
identified, fresh limits have to be drawn from the point where the new system has
taken effect. Average mR then would be for 12 values because 12 values would be
available.
After the worksheet has been field,
help can be taken of Chart –wizard feature of the software to build a
line-graph by selecting the rows of Period, X,
The charts then need to be modified
by right clicking the mouse on the chart area to get rid of the grid lines,
format data series pertaining to UCLx, LCLx, Avg X (also of UCL mR and Avg mR)
to have ‘no makers’ changing the co lour and style of lines to our choice and
replacing the makers of X (also of mR) with filled circles of weight 3. All
these can be done by right clicking the mouse on the related aspect and then
exercising choice. Since legend is not required, the same can be deleted. After
adjusting the size of the chart so that it fits in one paper width the two axes
may be formatted to have a font of about 7 or 8 point size.
If charts are prepared in this
manner any change in the data would automatically get reflected in the chart
Rules for
interpretation of X mR chart
The following constitute ‘signals’
that indicate possible personae of special cause (external to the system). Even
though they are not guaranteeing that one would not be making either of the two
types of mistakes (mistaking that a special cause exists where none exists, or
mistaking that no special cause exists where one exists) but present an
economic value at which the chances of making the two types of mistakes are
less.
1.
If any point on the X chart is outside the limits (higher
than the UCLx or lower than the LCLx)
2.
If any point in the mR chart is above the UCLmR
3.
If at least three out of four consecutive points in X chart are
closer to one of the control limits than to the average value.
4.
If at least eight consecutive points are the same side of
the average line on the X chart.
If the system is known to have changed
(new method of working, new equipment, new type of stock, etc) fresh limits
should be drawn after one has at least 5 or 6 points. Calculation may later
include more figures to reduce the uncertainties till reasonable amount of data
is available.
Similarly if the system found to
have changed (as a result of investigations) fresh charts need to be drawn
because the two sets of data (before and after the system change) do not come
from the same system.
If signals are present look for
special cause for the same and eliminate them (if the special cause is beneficial
make it a part of the system if adverse eliminate it). This will stabilise the
system.
In a stable system improvements
(reducing the variation – depicted by the difference between the UCLx and LCLx
and or improving the average value) can be made only by working on the system
and not by setting arbitrary goals or pressuring people or looking for
alternative method to calculate data.
Please note that large percent
differences do not necessarily indicate a signal likewise small percent
differences do not necessarily indicate lack of signal.